So ...
Sometimes you just want to dig a bit deeper to see how a given plugin is affecting your load time.
Needless to say, there are dozens of available tools out there ...
But you don't need any tools.
Why? Because, your can use your browser’s developer tools ...
Relax! I'm not talking about coding ...
Here's what you need to do ...
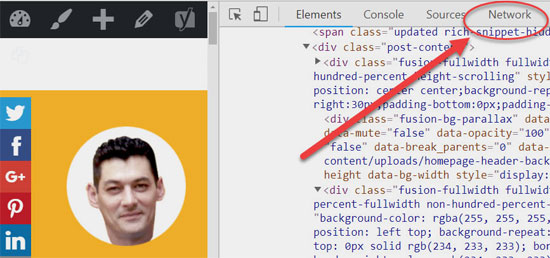
Open your site in Google Chrome, right click anywhere on your page and select "Inspect":

And once again, relax! There is no need for a stroke ...
All you need to do is to select the "Network" tab ...

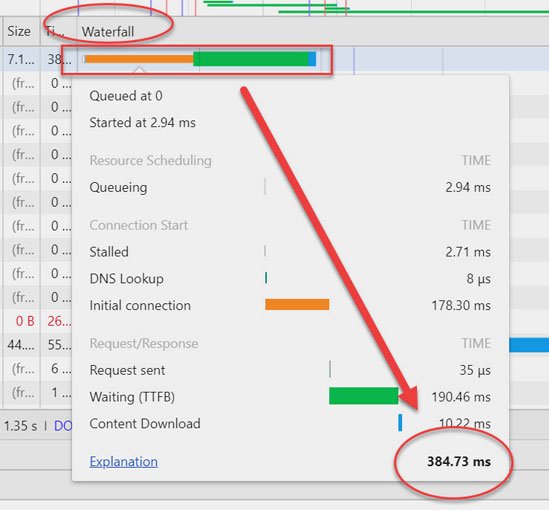
And you'll get another ugly table that contains a list with every single file (image, CSS, font, Javascript, etc) loaded on the given page.
And all you have to do is to hover your mouse over a given horizontal bar in the "Waterfall" column, and you'll be able to see the actual loading time of the given file:

As you can see, is really not rocket science ... With 3 simple clicks you can find out the actual loading time of any file.
And that's it my friends!
If you have any comments, further questions or update requests please don't hesitate to react! Like, comment and share!
And don't forget, you can easily come back to this tutorial whenever you want.
All you need to do is to bookmark the categorized, daily updated register of my blogs and training materials. Here it is:
Posts and training by smartketeer
Thanks for your time!


