What Do All These Scrum Terms Mean?
There are many complex ways of documenting a Scrum project. As might be expected, something that is used to control multi-million dollar projects has many ways of tailoring itself to their requirements.
We are looking at the other end of the scale, so we are after simplification.
We will use the bare minimum of the factors needed to maintain a Scrum project.
Epic
An Epic is the highest level of job in a Scrum project and will be comprised of a number of smaller tasks. It's goal will normally be expressed in general terms and will be a what is to be achieved, not a how to achieve it.
Story
A Story is the next highest level of job in a Scrum project. A simple project may consist entirely of Epics and the Stories that must be completed to achieve its goal.
They were originally called User Stories in software projects because they were expressed in terms of what the user needed, to ensure that software teams produced apps that people would actually use.
Task and Sub-task
These can be used to break a Story into Smaller Components.
Backlog
The Backlog is the list of all the Stories, Tasks and Sub-Tasks that remain to be done. One of the big advantages of the Backlog is that you now have somewhere to record all of the tasks arising from new things that come up. Instead of chasing after the latest "bright pebble" and falling down a rabbit hole that diverts you away from other work, just add it as a Story to the Backlog and then evaluate it against other Stories before starting the next Sprint.
Sprint
A Sprint is a short, fixed interval of time where we undertake to get a certain number of stories completed and evaluate our progress at the end. The jobs that will be undertaken during the Sprint are dragged into it from the Backlog. The most common Sprint length is two weeks.
Story Points
Story Points are a brilliant concept, but have been traditionally difficult for some people to grasp their importance.
It stems from the fact that we, as humans tend to badly underestimate how long it will take to do something. This is why so many software projects in the past were delivered late (sometimes by a year or more) and exceeded their budget by huge amounts.
But we are quite good at assessing the relative complexity of tasks. Including disparate ones. We might know, for example, that we can vacuum the house in less than half the time it takes to cook dinner and we can allocate resources accordingly.
So rather than estimate how long a Story is going to take, we assign a certain number of Story Points to it. How many? It doesn't really matter. What matters is that another Story that we think is twice as complex gets double the number of Story Points and one that is half as complex gets half the number.
You might start off by picking a Story that you are fairly confident you can finish in a day and give it 8 story points. Then allocate others according to the relative complexity to that one.
Now here's how it works:
When you plan your first sprint, you will naturally include all the stories that you think you can get done during the Sprint. Let's say, for example that comes to a total of 200 story points. But at the end of the Sprint, you've completed 120 Story Points and there are uncompleted Stories that have to be moved into the next Sprint.
That means you can base the next Sprint on actual experience, not notoriously unreliable human guesswork.
So you move enough Stories into the next Sprint to total 120 Story Points.
This process gets more and more accurate as time goes by.
Scrum Board

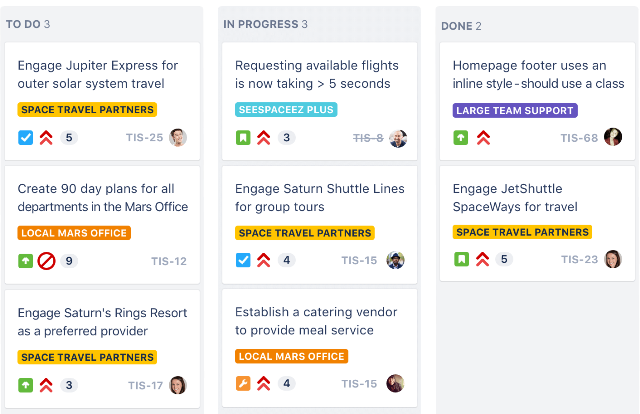
The Scrum Board is a visual representation of the Sprint and the Stories and Tasks included in it. In its simplest form, it has 3 columns, TO DO, IN PROGRESS and DONE. The first column is loaded up with all the Stories that are included in the Sprint and as work on them is started, they are moved to the second column and then onto the third when they are complete.
Originally, actual physical boards were used, with the Stories written on Post-It notes that were physically moved from one column to another. These have now been replaced with software that displays a physical representation and allows Stories to be dragged and dropped between columns.
At the end of the Sprint, everything should have moved from column 1 to column 3.
Burndown Chart

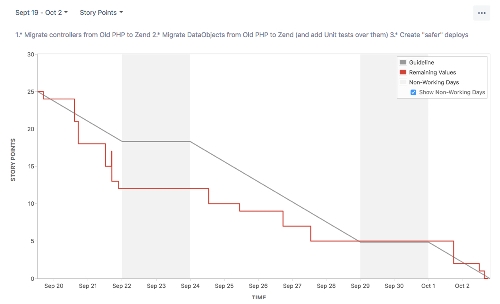
You will use the Burndown Chart frequently, as it shows your progress against the ideal. It's a great incentive to do better if you find that you are falling behind.
The Burndown Chart shows two graphs, superimposed.
In the chart shown above, the grey line shows the result of each story and task being completed on time, so that the line moves smoothly (with horizontal breaks for weekends) from everything in the To Do column at the start of the Sprint to everything in the Done column at the end of the Sprint.
The red line shows actual progress. The line is horizontal as time passes while a story or task is being worked on, then drops vertically when it's completed (moved to the Done column). Your aim is to see it drop to or below the ideal line at the end of each day. That's why I described it as an incentive.
Note in the example chart that the line turns upward near the end of the first work period. This means that an extra story has been moved into the Sprint, presumably overlooked when the Sprint was planned. Fortunately, the team was ahead of schedule at that point, so the actual line remained ahead of the ideal.
How to Do This
We will cover how you do all this in the next lesson.


