Understanding Google Analytics: A Practical Guide to Measuring Your Website’s Success


Published on March 14, 2026
Published on Wealthy Affiliate — a platform for building real online businesses with modern training and AI.

Meta Description:
Learn how Google Analytics works, what key metrics mean, and how to use GA4 effectively to understand website traffic and improve online performance.
Introduction
One of the biggest mistakes new website owners make is focusing only on building content while ignoring the data that shows whether their efforts are actually working.
This is where Google Analytics becomes invaluable.
Google Analytics is a powerful tool that allows website owners to understand:
- who is visiting their site;
- how visitors found it;
- what they do once they arrive; and
- whether those visits lead to meaningful results.
In simple terms, Google Analytics helps answer the most important question for any online entrepreneur:
“Is my website actually working?”
Understanding how to read and use this data can transform a website from a simple online presence into a data-driven business platform.
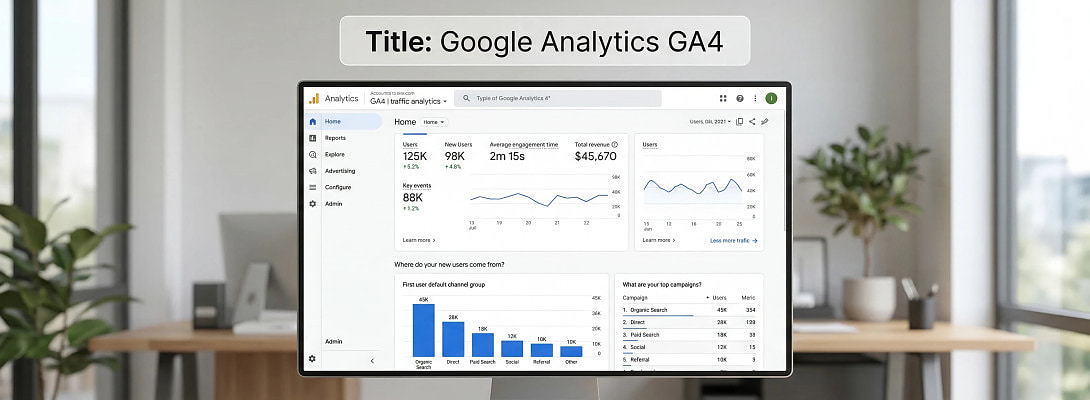
How Google Analytics Works
At its core, Google Analytics works through a small piece of tracking code that is added to every page of a website.
Once installed, the system works in three stages.
1. Data Collection
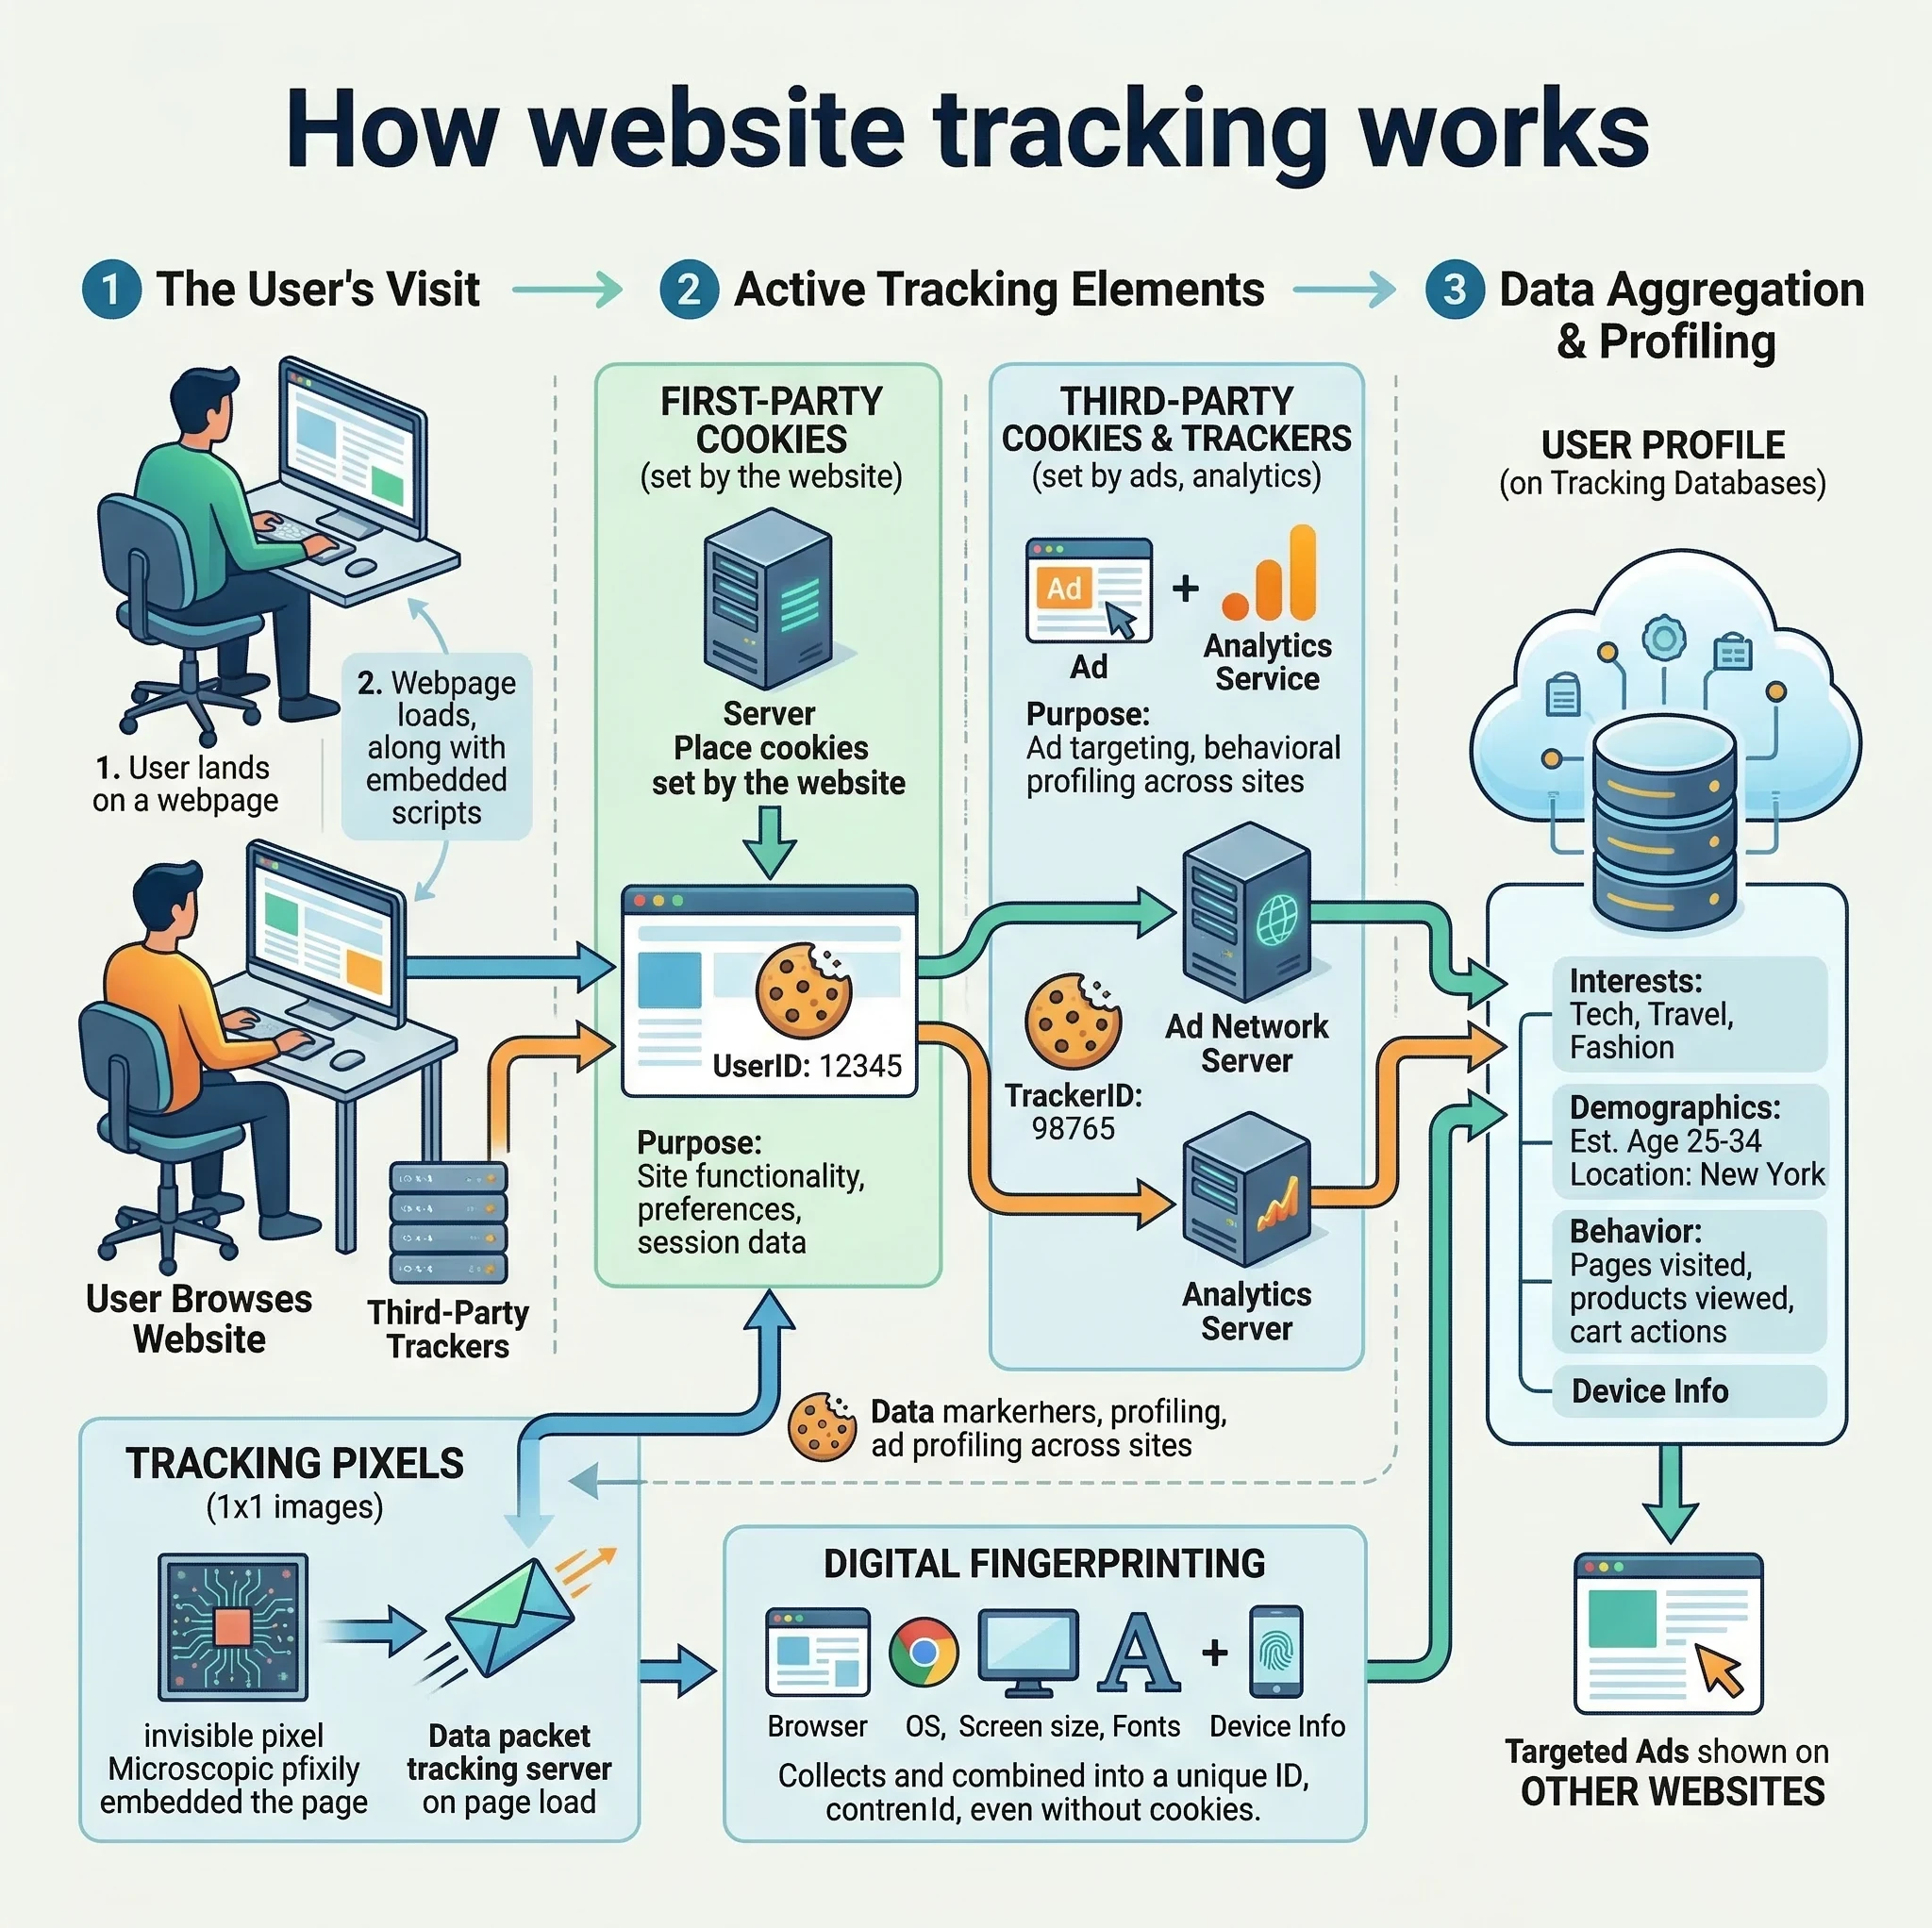
When someone visits your website, the tracking code records actions such as:
- page visits;
- clicks;
- their scrolling behavior; and
- the time spent on pages.
These actions are called events.
Each event is sent to Google's servers for processing.
2. Data Processing
After the data is collected, Google's system organizes it into meaningful categories and patterns.
The system filters spam, processes information, and prepares the data for reporting.
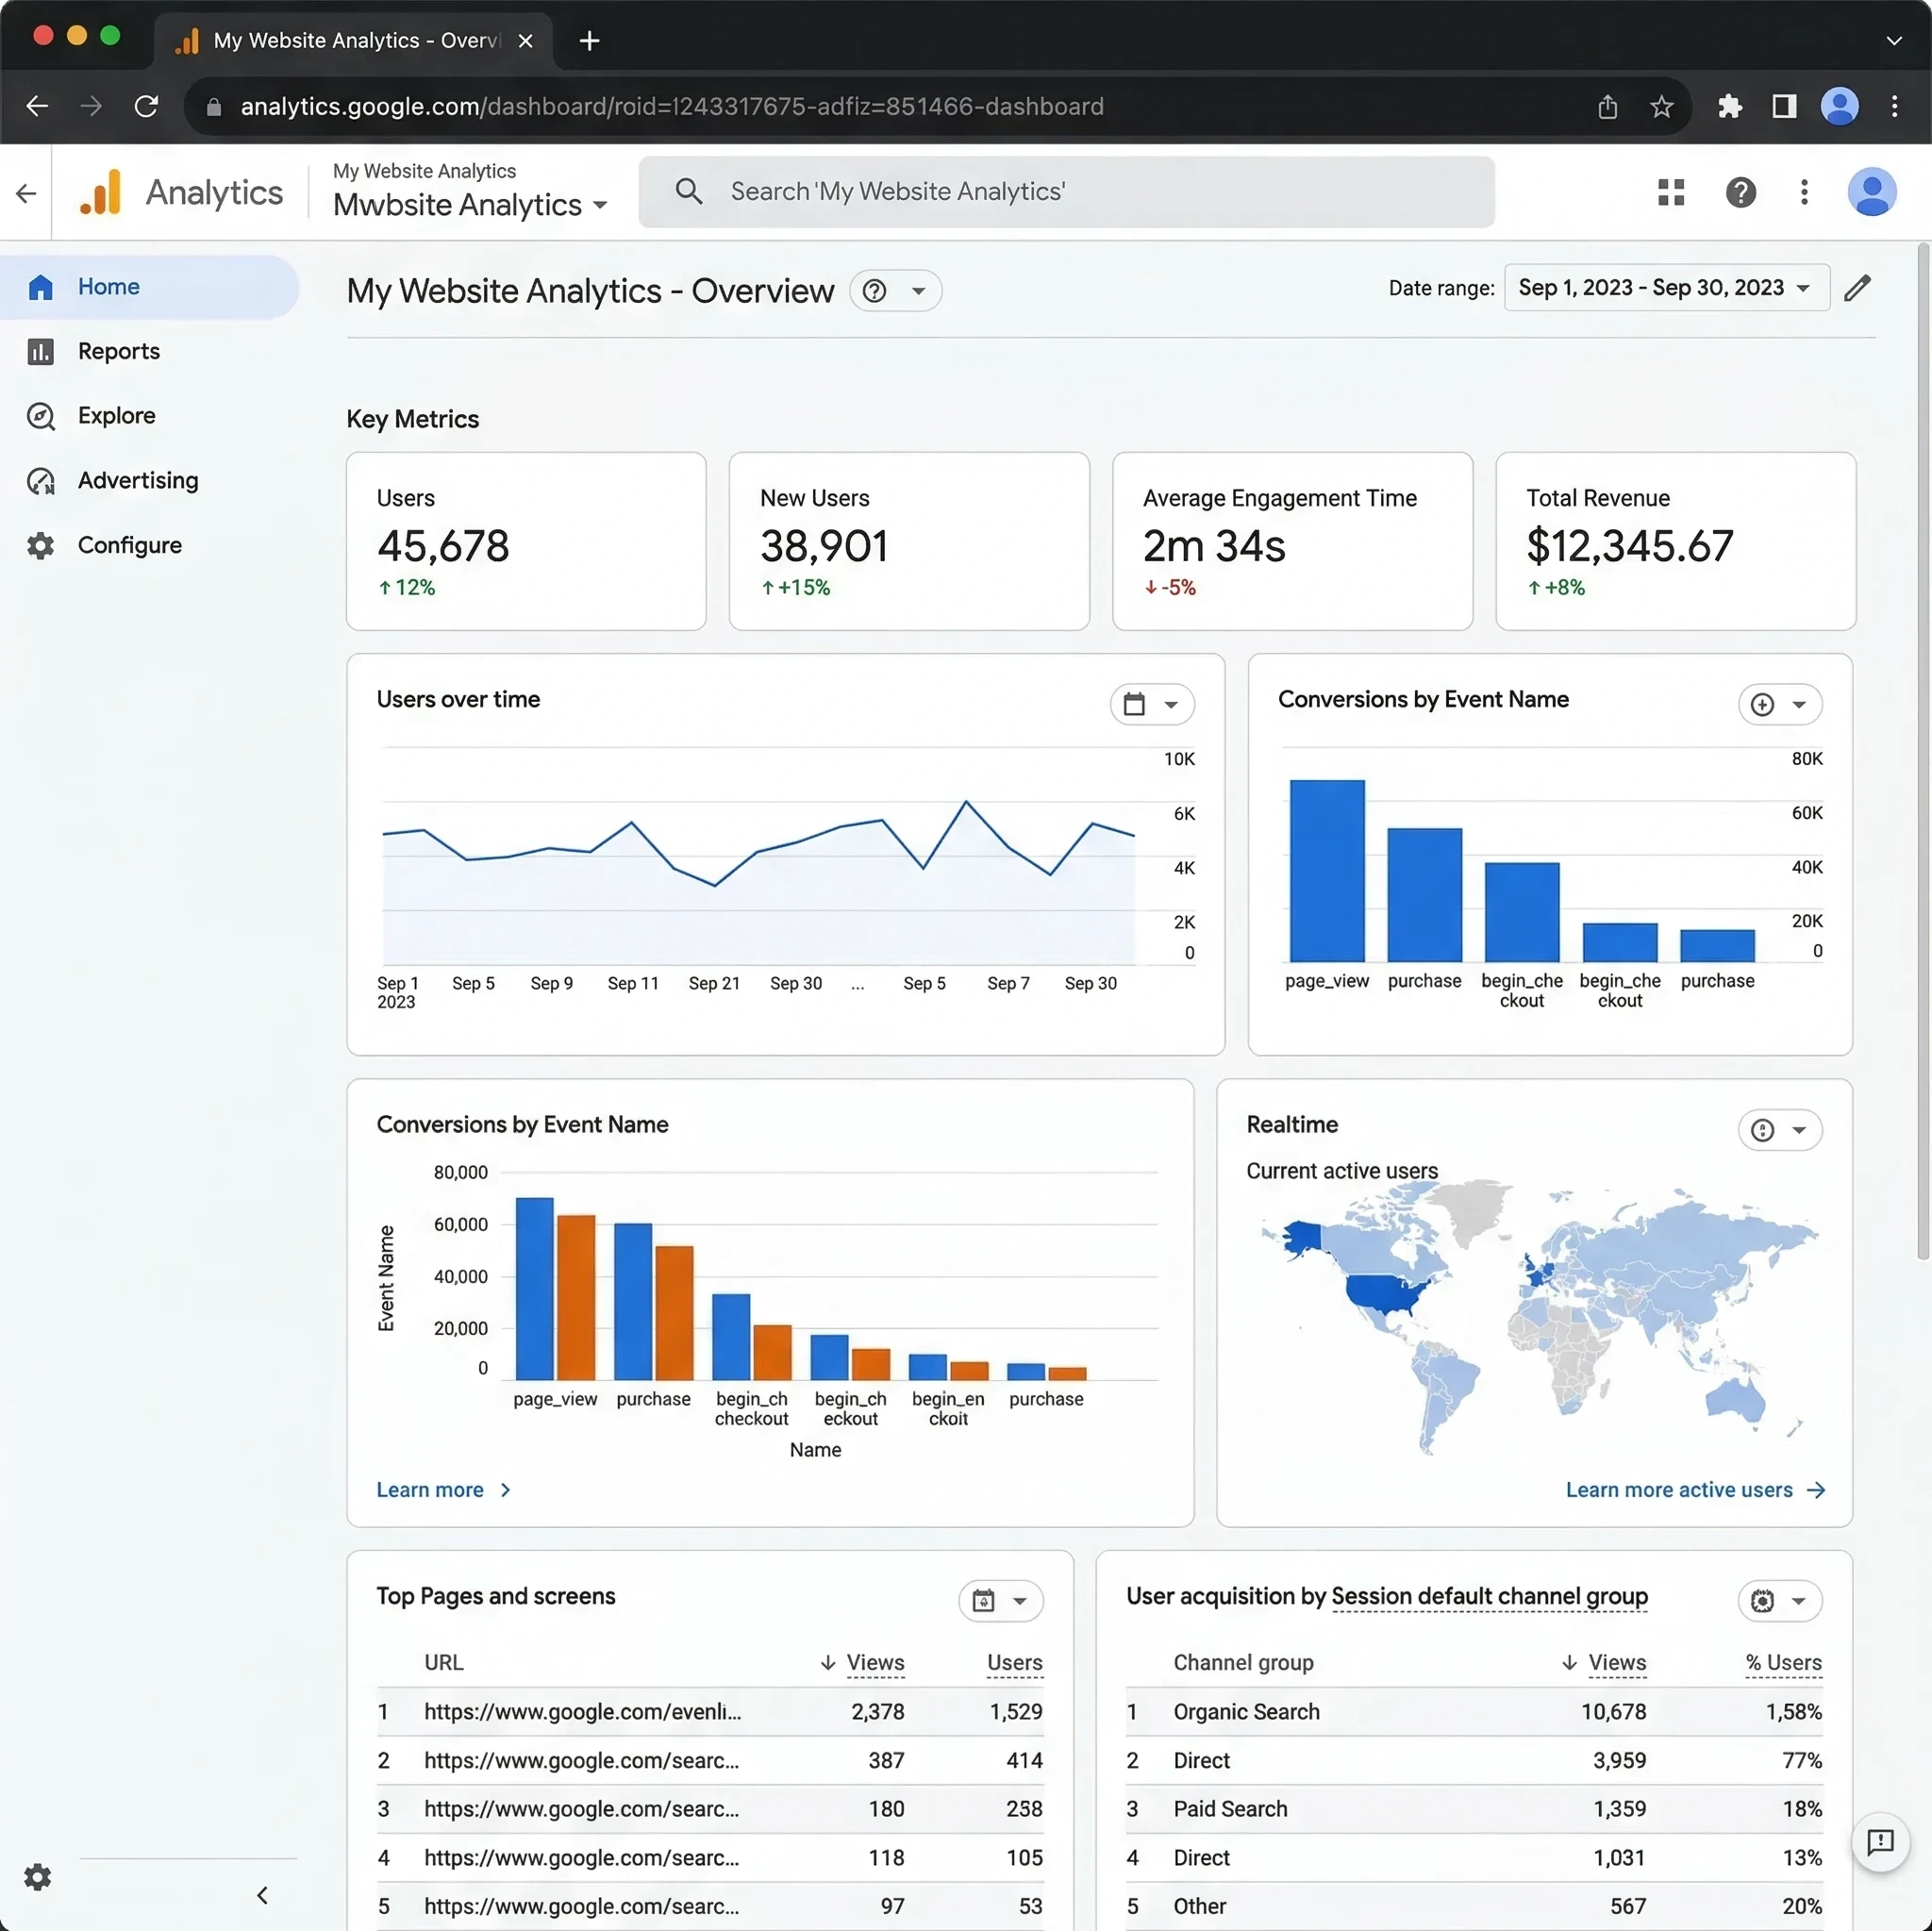
3. Reporting
The processed data appears in the Google Analytics dashboard, where website owners can view visual reports and statistics.
These reports allow you to see what content performs well and what areas of your website may need improvement.
Understanding the Language of Google Analytics
To interpret Google Analytics reports correctly, it is essential to understand two fundamental concepts.
Dimensions: The “What”
Dimensions describe characteristics of your data.
Examples include:
- the visitor's location;
- their device type;
- the traffic source; and
- the browser type.
For example:
City = New York
Device = Mobile
Source = Search Engine
Dimensions help explain where your traffic is coming from and who your visitors are.
Metrics: The “How Many”
Metrics measure quantitative values.
Examples include:
- the number of visitors;
- the time spent on pages;
- the number of clicks; and
- the conversions.
For example:
Total Users: 1,200
Engagement Rate: 65%
Metrics help you measure performance and growth.
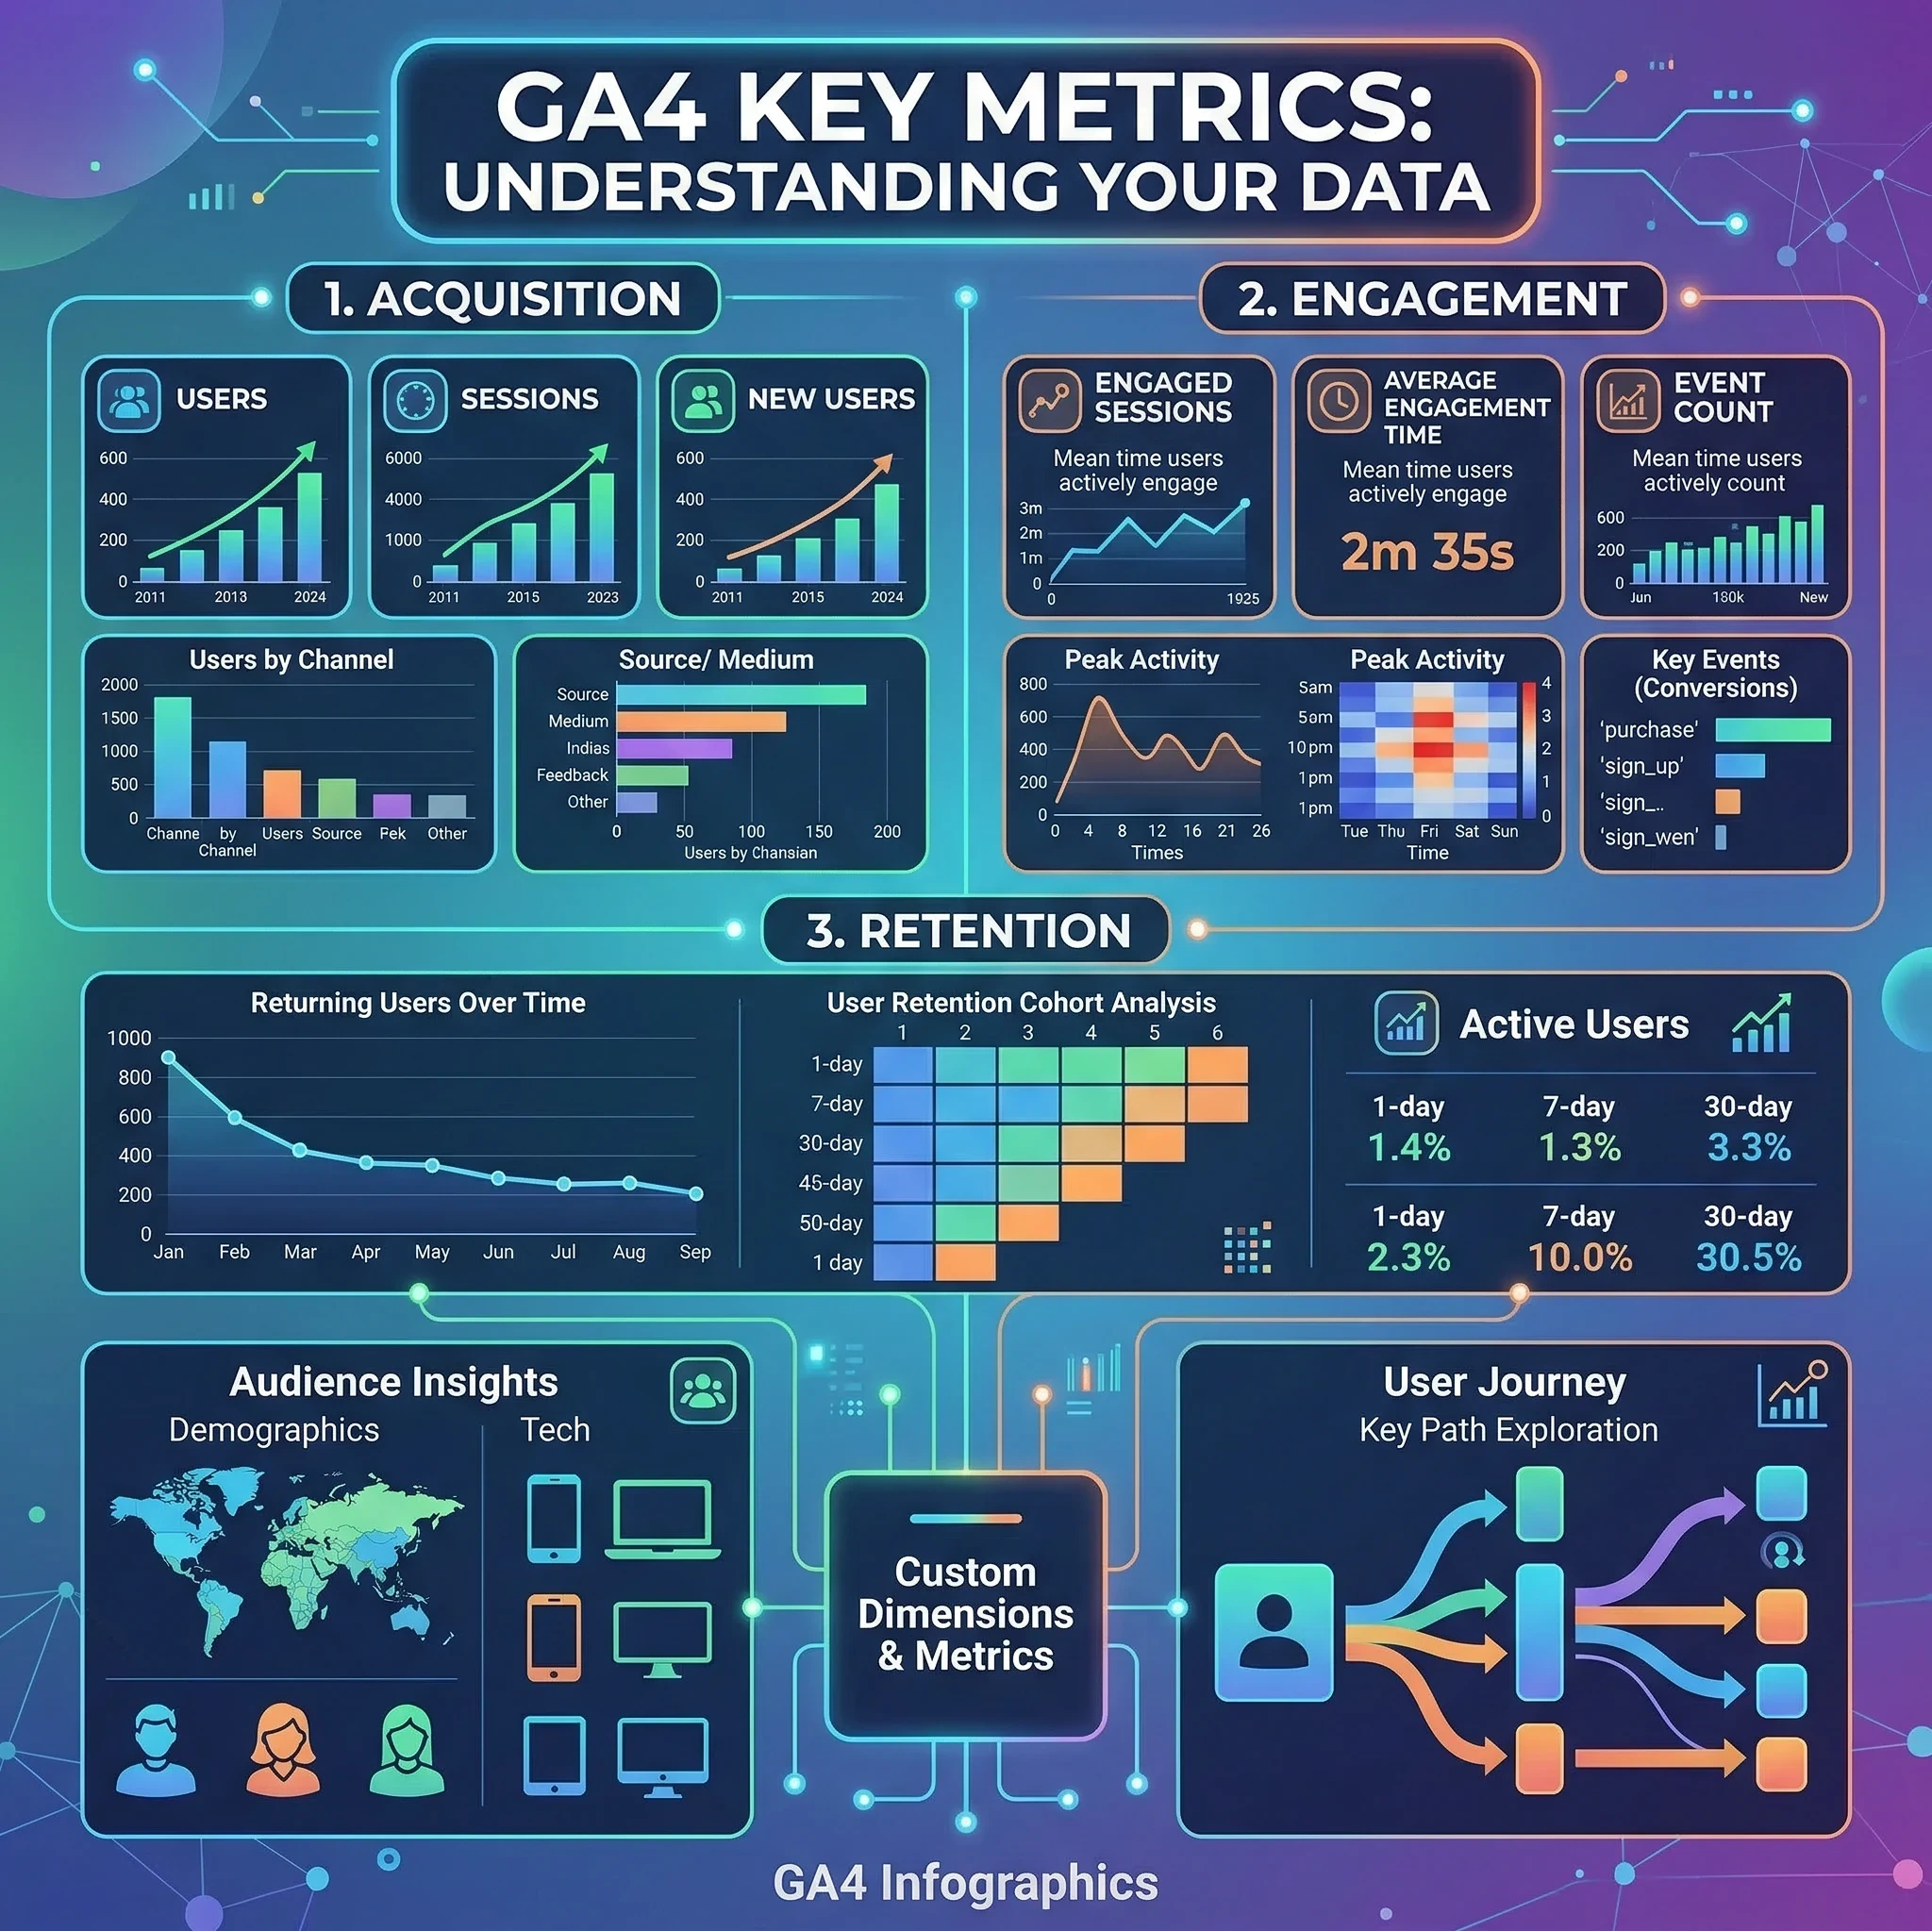
The Four Main Reporting Sections
Most users spend their time analyzing data within four primary report areas in Google Analytics 4 (GA4).
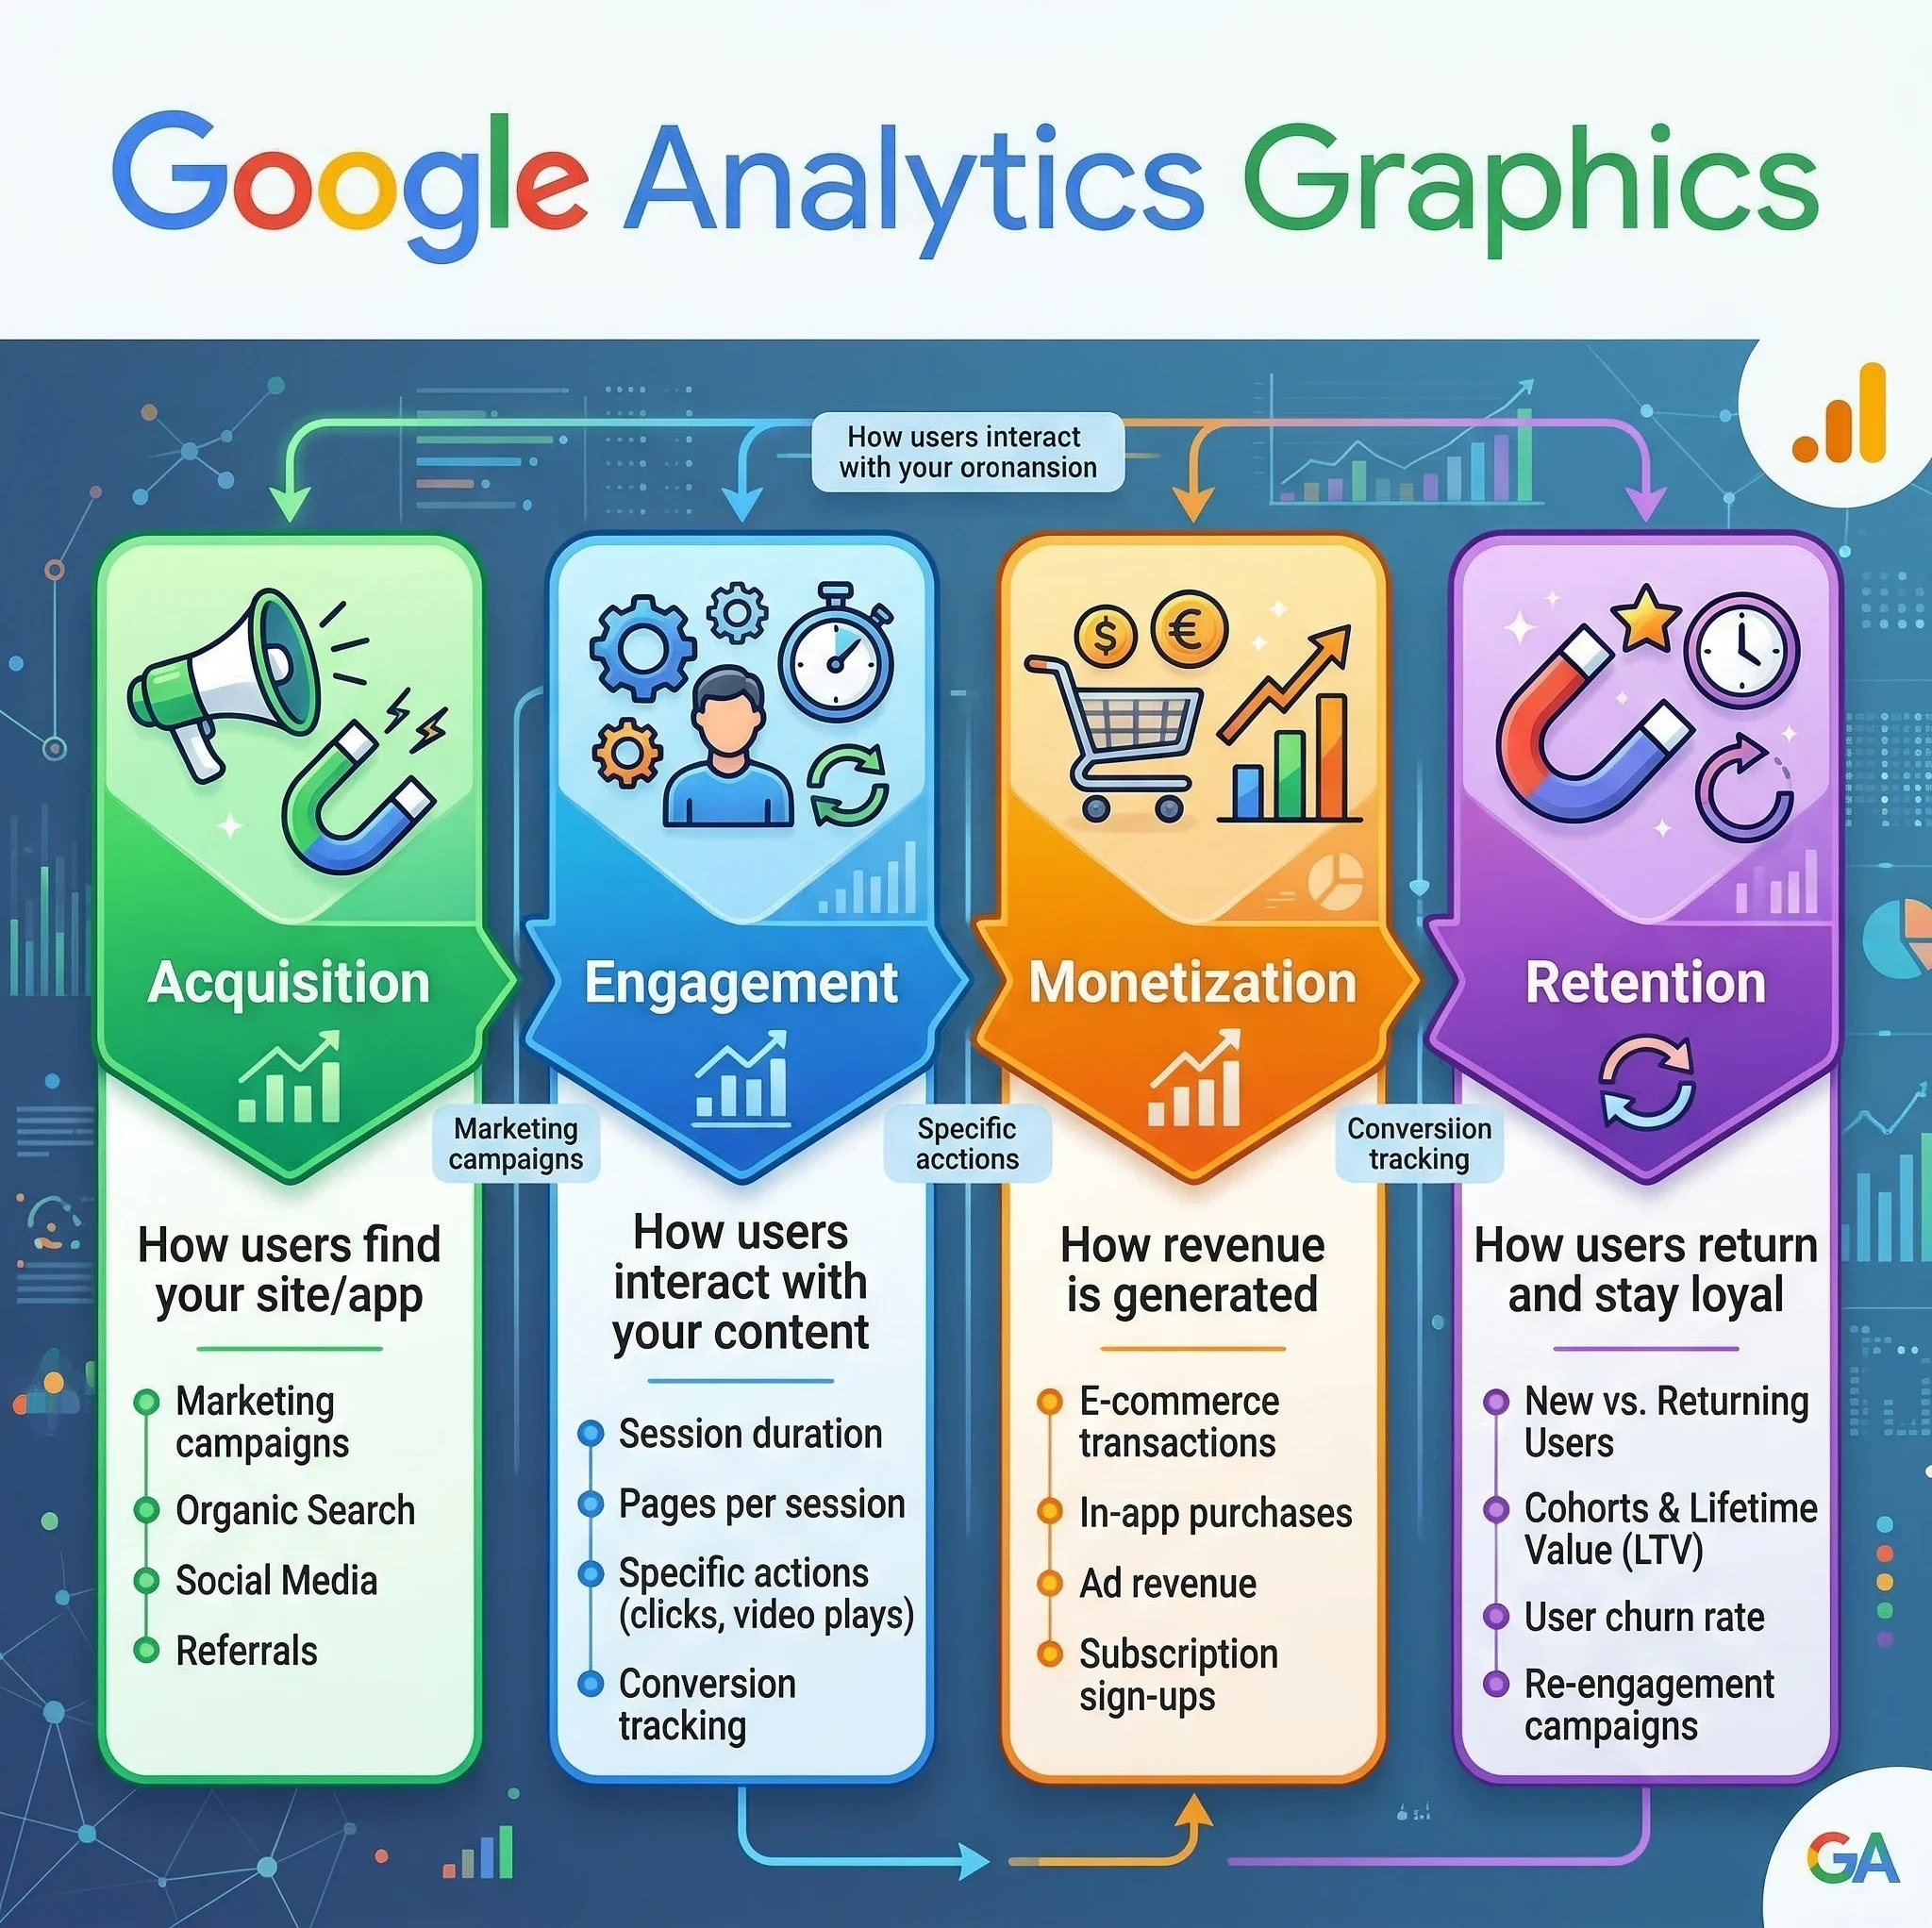
1. Acquisition: Where Visitors Come From
The Acquisition report shows how people find your website.
Common traffic sources include:
- the organic search;
- social media;
- paid advertisements;
- referral websites; and
- direct traffic.
This information is critical for understanding which marketing strategies are working best.
For example:
If most visitors arrive through search engines like Google, then your SEO strategy is performing well.
2. Engagement: What Visitors Do on Your Site
The Engagement report reveals how users interact with your website.
Ready to put this into action?
Start your free journey today — no credit card required.
Important insights include:
- which pages are the most popular;
- how long the visitors stay; and
- what content are they reading.
This data helps identify which articles or pages attract the most interest.
3. Monetization: Tracking Revenue
The Monetization section in Google Analytics 4 (GA4) is a specialized reporting area that tracks how your website or mobile app generates revenue. Unlike the standard "E-commerce" reports in older versions of Google Analytics, GA4's Monetization reports provide a unified view of income from web sales, app purchases, and digital advertisements
For websites that sell products or run advertisements, the Monetization section measures financial performance.
This report tracks:
- all purchases;
- ad revenue; and
- ecommerce transactions.
It allows businesses to determine which pages and campaigns generate income.
4. Retention: Do Visitors Come Back?
The Retention report summarizes how effectively your website or app keeps users coming back after their first visit, measuring how often users return to your website.
Returning visitors are valuable because they often become:
- loyal readers;
- subscribers; and
- customers.
High retention rates normally reflect (indicate) strong content and user experience.
GA4 vs the Older Analytics System
The current version of the platform is Google Analytics 4 (GA4).
It replaced the older Universal Analytics system.
GA4 introduced two major changes.
Event-Based Tracking
Event-based tracking is a method of digital analytics that records specific, individual actions (events) as they occur within a website or application. Unlike traditional tracking that focuses on page loads and sessions, this approach captures granular behaviors like button clicks, video plays, and form submissions to build a detailed picture of the user journey
So, instead of grouping data primarily into sessions, GA4 records nearly every interaction as an event.
Examples of events include:
- page views;
- button clicks;
- video plays; and
- downloads
This approach provides more detailed insights into user behavior.
Predictive Insights
Predictive Insights (often referred to as Predictive Metrics) use Google’s machine-learning algorithms to forecast future user behavior based on historical data. Unlike traditional analytics that report on what has happened, these insights identify patterns to tell you what is likely to happen next
Therefore, GA4 uses machine learning to estimate future behavior.
For example, the system can predict:
- the likelihood of a purchase;
- the probability of a user returning; and
- the risk of losing a visitor
These insights help businesses make more informed decisions.
Essential Metrics Every Website Owner Should Watch
When starting out, it is easy to become overwhelmed by the number of available metrics.
Instead, focus on a few key indicators.
Metric What It Means
Active Users Number of people visiting your site
Engagement Rate Percentage of meaningful visits
Average Engagement Time How long users interact with content
Conversions Actions like signups or purchases
Monitoring these metrics consistently provides a clear picture of your website’s health.
The Best Way to Use Google Analytics
Simply installing analytics is not enough.
The real value comes from using the data to guide decisions.
Here is a practical approach.
Step 1: Identify Your Traffic Sources
Check the Acquisition report to see where visitors originate.
This reveals whether your audience finds you through:
- search engines;
- social media;
- referrals; and
- direct visits.
This helps determine which marketing channels deserve more attention.
Step 2: Discover Your Most Popular Content
Look at the top-performing pages in the Engagement section.
Ask yourself:
- Which articles attract the most visitors?
- What topics generate the longest reading times?
These pages reveal what your audience values most.
Step 3: Improve Weak Pages
Pages with high traffic but low engagement may need improvement.
Possible improvements include:
- creating clearer headlines;
- providing better formatting;
- adding additional images; and
- having stronger introductions.
Making small adjustments continuously, can significantly improve your website's performance.
Step 4: Track Conversions
Define key events that represent success for your website.
Examples include:
- newsletter signups;
- product purchases; and
- affiliate link clicks.
Tracking these events allows you to measure whether your content leads to meaningful results.
Step 5: Monitor Website Growth Over Time
Instead of checking analytics daily, evaluate your site’s progress over longer periods.
Monthly trends provide clearer insights into:
- traffic growth;
- your audience behavior; and
- your site's marketing effectiveness.
Consistency matters more than short-term fluctuations.
Why Google Analytics Is Essential for Online Entrepreneurs
For anyone building a digital business, analytics provides the information needed to make smart decisions.
Without data, website owners are essentially guessing.
With analytics, they can:
- better understand audience behavior;
- quickly identify high-performing content;
- improve their marketing strategies; and
- consistently increase website traffic
Many platforms that teach digital marketing skills, including Wealthy Affiliate, emphasize analytics because it allows entrepreneurs to measure and refine their strategies.
Final Thoughts
Google Analytics is not simply a statistics tool.
It is a strategic decision-making platform.
By learning how to interpret traffic patterns, engagement data, and conversion metrics, website owners gain a deeper understanding of how their online presence performs.
Over time, these insights allow entrepreneurs to refine their content, improve their marketing strategies, and build more successful websites.
In the world of online business, data is not just information—it is guidance.
Share this insight
This conversation is happening inside the community.
Join free to continue it.The Internet Changed. Now It Is Time to Build Differently.
If this article resonated, the next step is learning how to apply it. Inside Wealthy Affiliate, we break this down into practical steps you can use to build a real online business.
No credit card. Instant access.