Why We Crave Infographics? New Interactive Infographic Gives Us 13 Reasons Why
1


Infographics allow website visitors to digest more information than through text alone on a specific subject, as they’re visually appealing and when designed well a whole lot more scannable.
But why do our brains crave them and when we stumble across an interesting infographic why do we have to read it there are then?
A new interactive info-graphic from NeoMan aims to find out, with some incredibly interesting facts and figures on infographics and the human brain.

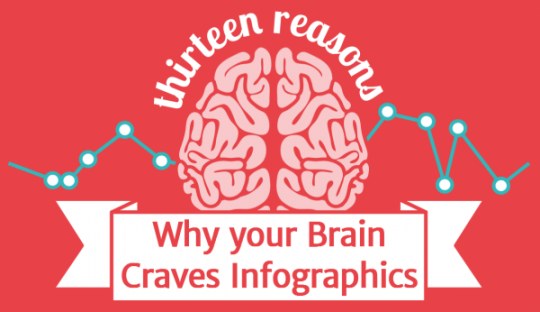
Key facts from the infographic
- Almost 50% of your brain is involved in visual processing
- Infographics counter information overload due to being more visually appealing
- 67% vs. 50% of an audience were persuaded by a message with visual information
- 80% of people remember what they see and do vs. 20% of people remember what they read


The infographic is interactive so features some funky animations. There are plenty of other interesting facts in the infographic to feast your eyes on too.
We would have embedded the full infographic below so you didn't need to actively visit another website, but alas the interactive infographic is non embedding.
So you’ll need to follow this link to the full infographic by the team at NeoMan for further reading. http://neomam.com/interactive/13reasons/
Enjoy!


Create Your Free Wealthy Affiliate Account Today!

4-Steps to Success Class

One Profit Ready Website

Market Research & Analysis Tools

Millionaire Mentorship

Core “Business Start Up” Training
Recent Comments
1
Create Your Free Wealthy Affiliate Account Today!
4-Steps to Success Class
One Profit Ready Website
Market Research & Analysis Tools
Millionaire Mentorship
Core “Business Start Up” Training
Thanks for sharing this. Being an infographic junkie I need no persuading of the effectiveness of them but it was interesting to see one with animations.