Scaling the $1/Day Strategy — From Data to Direction


Published on October 29, 2025
Published on Wealthy Affiliate — a platform for building real online businesses with modern training and AI.


Five days ago, I shared my first results testing Kyle’s $1/day Facebook Ad formula.
If you missed that one, you can read it here:
My Week 5 Facebook Ad Challenge Results: Testing Kyle’s $1/Day Formula
That post covered how I launched three different ad types: engagement, link clicks, and conversation -- all on a $1/day budget. This week, I scaled the same strategy, tracked results across Google Analytics, GoDaddy, and Wealthy Affiliate, and even applied the same method to a client project.
Traffic & Click Growth
Between October 22–29, my Wealthy Affiliate referral data showed a major spike in clicks and engagement.
Here’s the breakdown:
- October 22: 2 unique clicks, 8 content clicks
- October 23: 1 unique click, 8 content clicks
- October 24: 0 unique clicks, 8 content clicks
- October 25: 32 unique clicks, 14 content clicks
- October 26: 62 unique clicks, 17 content clicks
- October 27: 34 unique clicks, 21 content clicks
- October 28: 37 unique clicks, 18 content clicks
- October 29: 33 unique clicks, 14 content clicks
That’s roughly a 1900% increase in activity compared to the week before these ads started running and all on less than $8 total ad spend.
Cross-Platform Verification (Google Analytics)
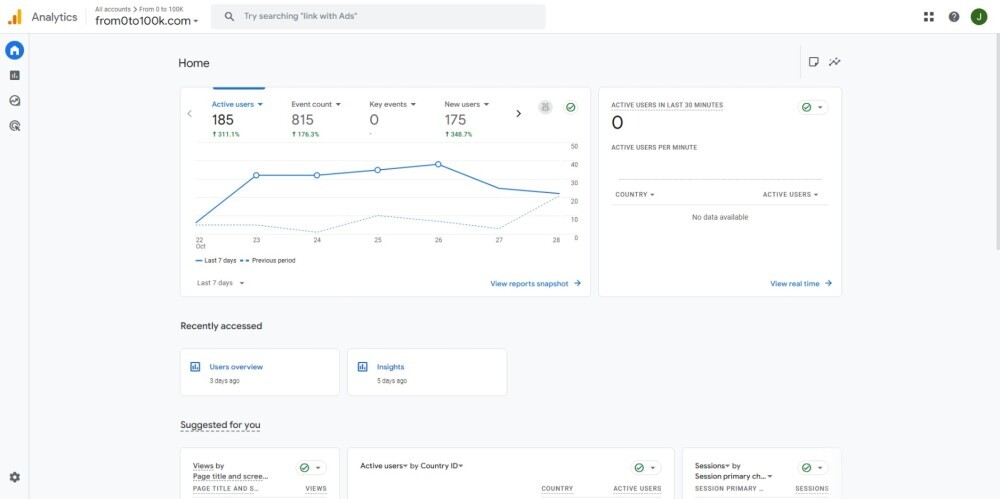
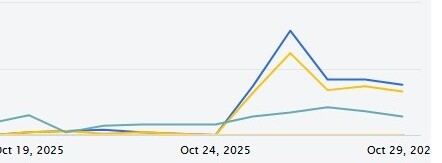
According to Google Analytics, my site from0to100k.com jumped significantly during the same time frame:
- 185 active users (+311%)
- 175 new users (+349%)
- 815 tracked events (+176%)
The majority of traffic came from Facebook (both organic and paid), followed by direct visits.
That confirms the clicks were legitimate, meaning real users exploring multiple pages and spending time on-site.
Website Health & Engagement
Ready to put this into action?
Start your free journey today — no credit card required.
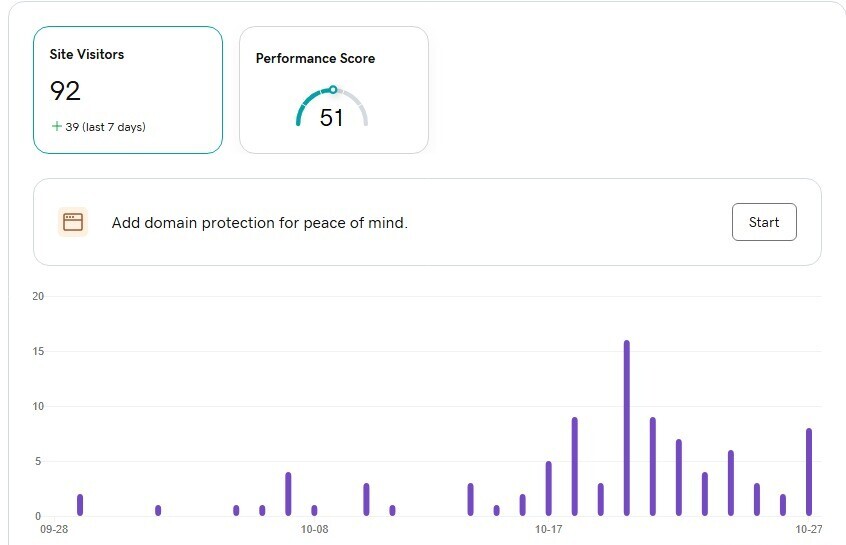
My hosting dashboard on a client site mirrored the same growth. Traffic nearly doubled in seven days with 92 visitors and several repeat sessions. It might sound small, but the steady climb shows how consistent micro-ad spending builds exposure over time.
Ad Performance Breakdown
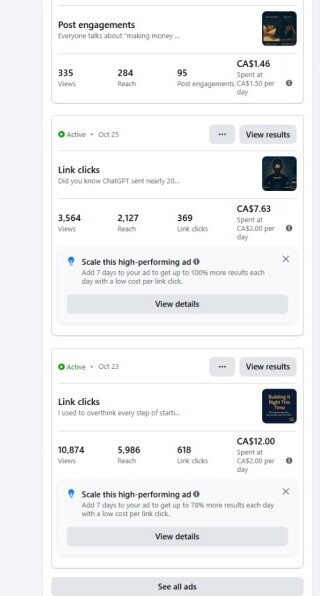
Here’s how the $1/day formula translated into performance metrics:
- Ad 1 (Link Clicks): 10,874 views, 618 link clicks, $0.02 CPC
- Ad 2 (Engagement Post): 3,564 views, 369 clicks, $7.63 total spend
- Ad 3 (Conversation Test): 650 reach, 56 link clicks, $0.02 CPC
Audience details:
- 60% women / 40% men
- Ages 25–44 dominated engagement
- Top countries: Canada, United States, Costa Rica, and parts of Central America
These numbers align almost perfectly with Kyle’s “micro-ad” approach: low-cost ads generating real behavioral data.
Client Application: FlyFishCR.com
This week, I applied the same ad structure to a client’s site, a fly-fishing retreat in Costa Rica.
The goal was simple: convert small, targeted ad tests into potential bookings for the upcoming travel season.
The ad targeted adventure travel, ecotourism, and fly-fishing enthusiasts across Belize, Honduras, Mexico, Panama, and Costa Rica.
After just one day:
- 397 reach
- 56 link clicks
- $0.02 cost per click
That’s a strong start and early proof this same framework works across industries and not just affiliate marketing.
Lessons Learned from Scaling the Strategy
- Low-cost ads deliver high-quality insights.
You don’t need to outspend anyone. The key is studying what happens once your message hits the feed. - Cross-platform tracking validates results.
When you see consistent growth across Wealthy Affiliate, Google Analytics, and your hosting dashboard; it’s not coincidence. It’s data alignment. - Client testing expands credibility.
Running the same structure on client projects strengthens confidence in the method and widens your case study base.
Closing Reflection
This experiment reminded me that clarity always beats cost. Running small, intentional ads created measurable progress, real engagement, and deeper understanding of what audiences respond to.
I’m not chasing viral numbers here, I’m chasing understanding.
Every click, chart, and impression is another data point in the journey toward building smarter, more authentic connections online.
Share this insight
This conversation is happening inside the community.
Join free to continue it.The Internet Changed. Now It Is Time to Build Differently.
If this article resonated, the next step is learning how to apply it. Inside Wealthy Affiliate, we break this down into practical steps you can use to build a real online business.
No credit card. Instant access.