Who wants an analytics chart in Excel?


Hi,
I finally decided to put together an excel chart with my different tracking things I've been watching. Here is a link to it if you'd like to download it and adjust it to your own particular niche sites. If you need any explanation for any of the columns, please let me know. I'll try to give a brief explanation of each column below.
http://bit.ly/2pT8U3n (excel chart)

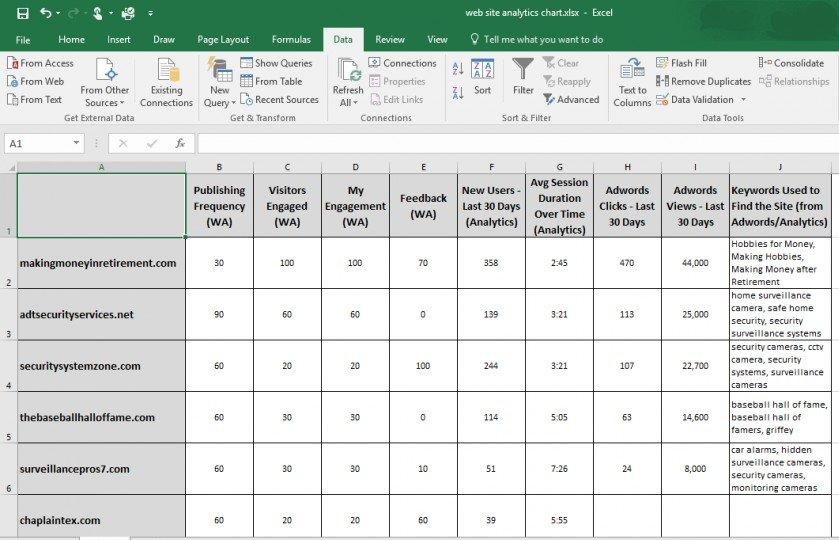
Publishing Frequency: What the WA analytic says for this site on this particular day (1-100%)
Visitors Engaged: Based on using the WA comments tool (1-100%)
My Engagement: My engagement to comments left via the WA comments tool (1-100%)
Feedback: Amount of feedback I have requested via the WA Feedback request tool (1-100%)
New Users over the last 30 days: What Google Analytics says re: this
Average Session Duration over time: How much time ppl are spending on my site according to Google Analytics
Adwords Clicks: How many clicks my current Adwords Ad is getting over the last 30 Days
Adwords Views: How many impressions my Adwords Ads have gotten over the last 30 days
Keywords: What keywords people are using to find my site according to my Adwords Ad
Hope this helps!
Tim


Recent Comments
22


Hey Tim,
This is a great idea for keeping track of your sites. Thanks for sharing it.
Jerome


Tim, this is great! a tutorial on this would be rather awesome. It really seems very promising. Keep at it! Thanks for sharing.
Or maybe I'll do it on youtube. I just learned how to record my screen the other day. There's a free way to do it with the Xbox app on Windows 10.
So many ideas, What should I focus on lol.
See more comments
Thanks for sharing.
James
You're very welcome!