How to See In Google Search Console How Searchers Interact With Your Results


Yesterday, we looked at how to see in Google Search Console what keywords your site/pages rank for. I hope you did that to a “wow!”
As promised, today, we are going to look at how searchers interact with your results.

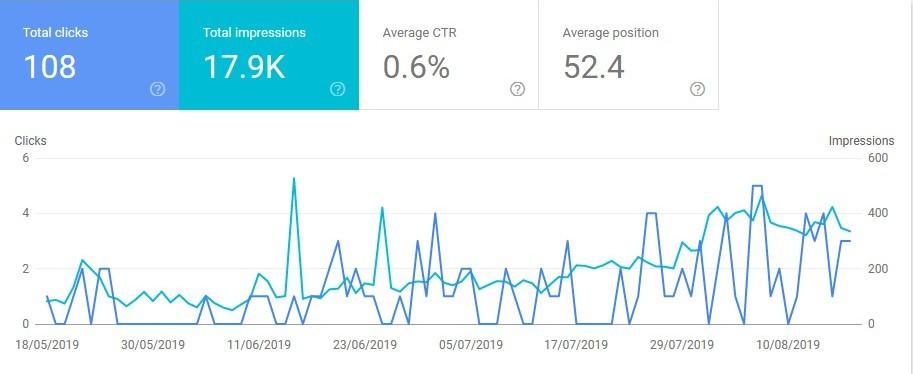
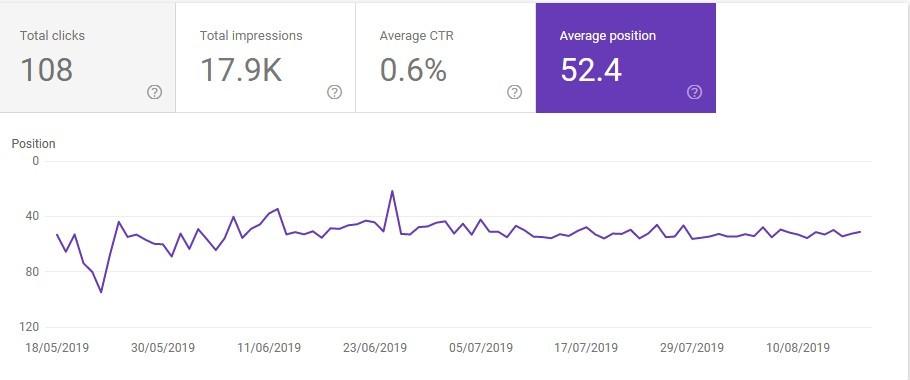
At the top of the graph above you can see four metrics:
- Total clicks,
- Total impressions,
- Average CTR (click-through rate), and
- Average position.
Total clicks denote the total number of times people clicked on your search results within the default selected timeframe.
Total impressions are the total number of times people saw your results in search during the selected timeframe.
Average CTR is the number of clicks divided by the number of impressions in the course of the selected timeframe.
Average position: tells you where you’re ranked in the search results for specific keywords.
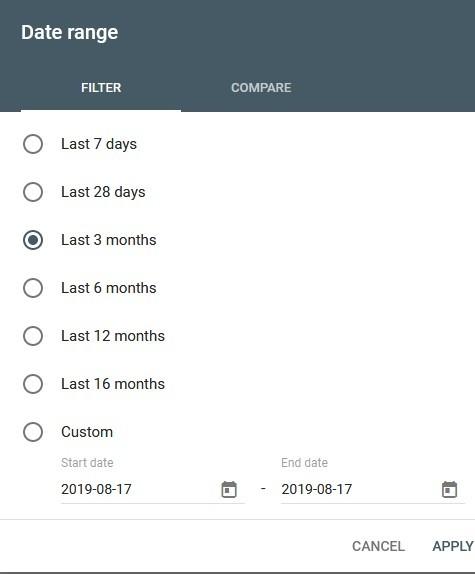
By default, the stats you have are for 3 months for each of the 4 metrics. But you can select other time frames, like you see in the screenshot below.

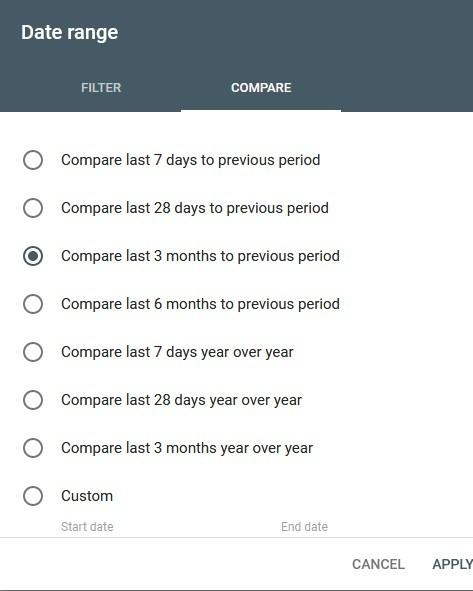
You can even compare as you see below.

By default also, Google Search Console gives the data in the performance report across your entire website.
If you want the results for your specific pages, you have to click the “Pages” tab and then select a page. The report will display the data for that specific page.
Now, anytime you select any of the 4 metrics, the background changes color from white. (Go ahead and click each of the metrics.) This is so you know which metric you’re looking at.

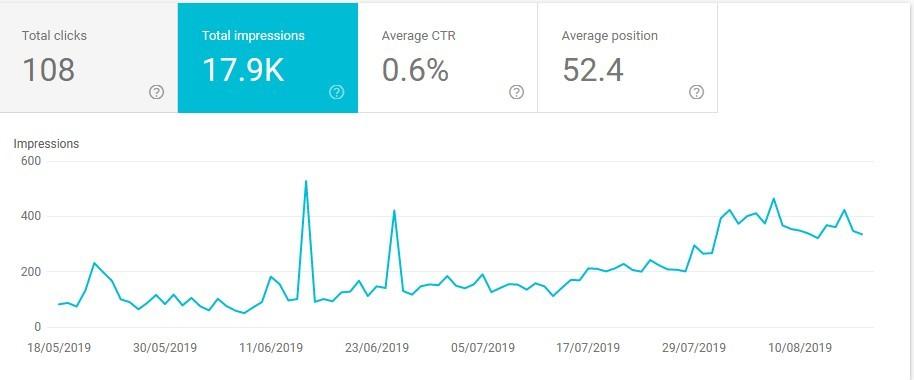
You would note that when you select a metric, Google Search Console displays the data in both the performance graph and in the table below it.

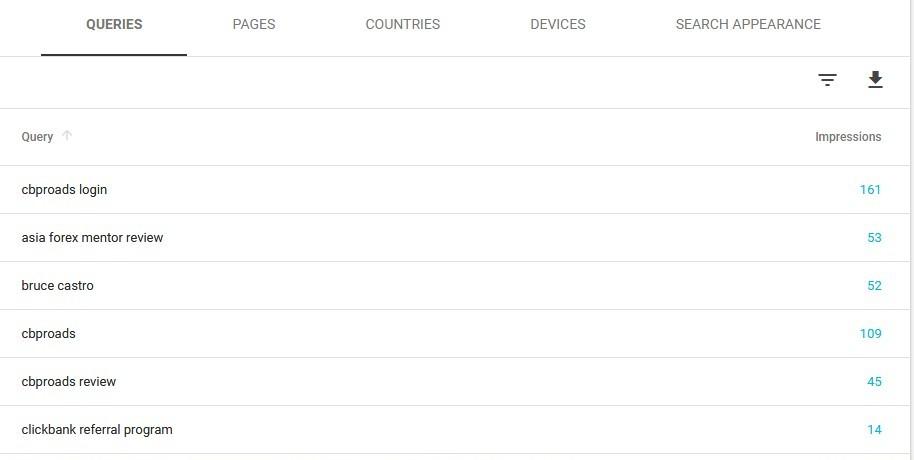
Go on and click on the “Queries” tab. You have:
- The number of times people searching saw your result for specific keywords
- How often they clicked those results, and
- Your overall click-through rate.
Now, concerning the “Position”, if you see 1, then you’re the top result. 10 is the bottom of page 1. And 11 is the top of page two, and so on.
Now, why is this metric not labelled simply “Position” but “Average position”?
It is an average, i.e. the sum of positions divided by the total number of keywords you rank for.

The default report displays the average of your positions for every keyword your entire site ranks for.
However you can filter by page to show the average of positions for all keywords a specific page ranks for.
Now, scroll down to the table below the graph. What you see is what position you rank in for each individual keyword.

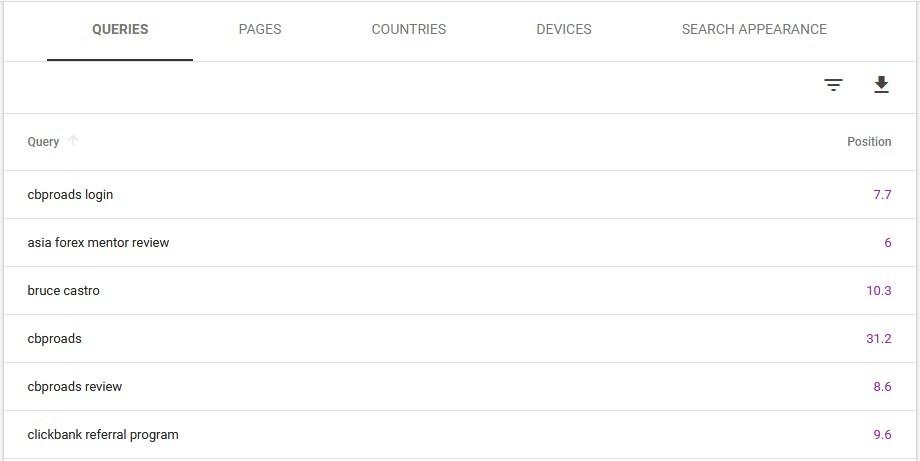
This data lets you see exactly where each page of your site ranks for specific keywords.
Now, if you make on-site adjustments and optimizations, you can use it to “monitor how your rankings change.
That’s it for how users interact with your results.
Tomorrow we will show you how to find how many pages of your site are in Google’s index.
Akoli


Recent Comments
6


Thank you so much I have never checked google search console I wanted my website to grow but I now feel it’s time to do so.

Yes, Cinderella, going to Google SearchConsole maybe an eye-opener for you.
Thanks for commenting.

See more comments
Thank you for sharing.
Thank you, and enjoy!